https://blog.csdn.net/root45/article/details/7034843
1. 概述
在数据包的发送过程中,通过路由获得下一跳的 L3 地址,下一步是获得此 L3 地址所对应的 L2 地址,这个过程称为 neighbor discovery。IPv4对应的是 ARP 协议,IPv6 对应的是Neighbor Discovery 协议。
Linux 中,用于处理neighbor discovery的模块称为 neighboring subsystem。它分为两层,底层是通用框架 neighboring infrastructure,在此之上,又有不同的具体实现,例如ARP 模块、 ND 模块等。
Neighboring subsystem 的主要任务包括:
1、Neighbour discovery;通过 L3 地址找到 L2 地址;为发送数据提供保障
2、接收 neighbor 包并进行处理
3、提供 cache,以加速 neighboring 的过程
4、为系统中其它模块需要 neighboring discovery 而提供 APIs
2. Neighboring infrastructure
2.1 主要数据结构:
1、 struct neighbour
最主要的结构
2、 struct neigh_table
用于管理 struct neighbour
3、 struct neigh_ops
用于映射到 L2 的输出函数
4、 struct neigh_parms
5、 struct hh_cache
2.2 数据结构关系:
下图是 neighboring subsystem 中数据结构关系图,其关系可描述如下:
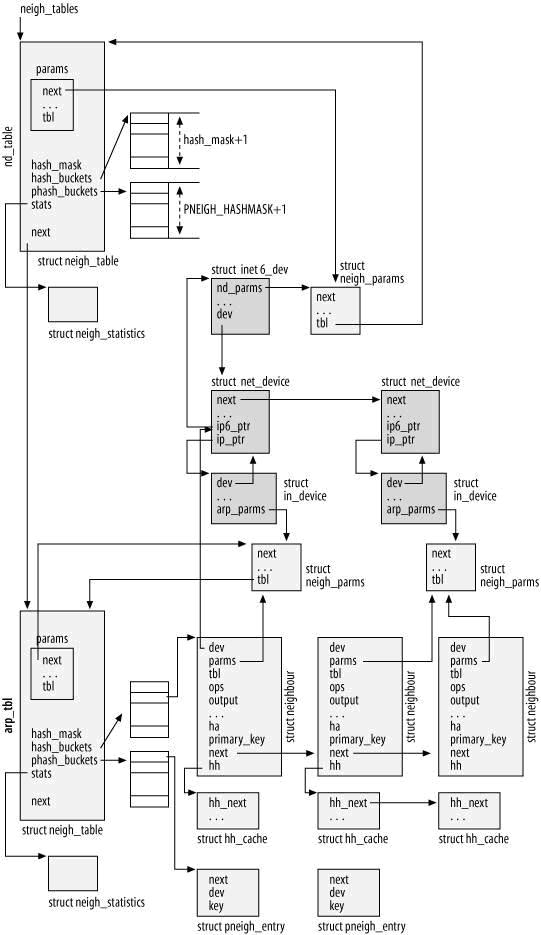
1、系统通过 neigh_tables 来管理各种具体的 neigh_table,包括 arp_tbl 和 nd_table
2、Neigh_table 通过 hash_buckets 来维护一个 neigh_table 的 hash 表。可以迅速的增加、删除、查找 neighbour
3、neighbour 的作用??? Neighbour 的 parms 指向 neigh_parms 结构,此结构用于 neighbour 的维护,例如重传次数,状态转换时间,垃圾收集时间等。
4、neighbour 的 ops 指向 neigh_ops 结构,此结构用于???
5、neighbour 的 hh 指向 hh_cache,此结构用于 cache L2 地址,以加速 L3 到 L2 的映射过程。
2.3 工具函数
1
| struct neighbour *neigh_alloc(struct neigh_table *tbl)
|
创建一个 neighbour,并初始化,它只被 neighbour_create() 调用
1
| struct neighbour * neigh_create(struct neigh_table *tbl, const void *pkey, struct net_device *dev)
|
调用 neigh_alloc() 分配一个 neighboure ,然后进一步调用具体协议的构造函数,以及具体设备的特殊的设置函数;最后,将此 neighbour 加入 neighbour table 中
它主要被 __neigh_lookup() 调用,也就是说,当在 neighbour table 中找不到 neighbour 的时候,调用此函数来创建一个新的 neighbour
1
| struct neighbour *neigh_lookup(struct neigh_table *tbl, const void *pkey, struct net_device *dev)
|
在 neighbour table 中寻找特定的 neighbour
1
| static void neigh_timer_handler(unsigned long arg)
|
这是一个定时器处理函数。当某个 neighbour 超时后,由此函数处理。
1
| int neigh_update(struct neighbour *neigh, const u8 *lladdr, u8 new, int override, int arp)
|
1
| void neigh_table_init(struct neigh_table *tbl)
|
用于初始化一个 neigh_table。
每个 table 有一个定时器函数,用于垃圾收集,也就是清除那些超时的 neighbour.
1
2
3
4
5
6
| init_timer(&tbl->gc_timer);
tbl->lock = RW_LOCK_UNLOCKED;
tbl->gc_timer.data = (unsigned long)tbl;
tbl->gc_timer.function = neigh_periodic_timer;
tbl->gc_timer.expires = now + 1;
add_timer(&tbl->gc_timer);
|
这个 neigh_periodic_timer 实际是
static void SMP_TIMER_NAME(neigh_periodic_timer)(unsigned long arg)
1
| int neigh_table_clear(struct neigh_table *tbl)
|
Neigh_table 通过 hash 表来维护 neighbour
1
| struct neighbour **hash_buckets;
|
具体的协议实现需要提高 hash 函数,例如 arp_hash()
neigh_hash_alloc 用于创建 hash 表
3. Neighbour 系统的初始化
全局变量 neigh_tables 维护系统中所有的 neigh_table
1
| static struct neigh_table *neigh_tables;
|
IPv4 ARP 的初始化:
调用neigh_table_init() 对 arp_tbl 初始化
调用dev_add_pack(&arp_packet_type) ,注册 ARP 包接收函数
IPv6 Neighborour Discovery 的初始化:
调用 neigh_table_init(&nd_tbl) 对 nd_tbl 初始化
IPv6 通过 ICMPv6 来处理 ND 的包,没有专门的 ARP包类型。
发送数据包过程中,在路由过程中,与 neighbour 结构进行关联,路由结束后,数据包交给 neighboring subsystem 进一步处理。
4. Routing与 Neighboring subsystem的关联
4.1 Neighbour与路由的关联
在路由过程中,需要寻找或创建 struct dst_entry (另一种形式是 struct rtable)。 dst_entry 通过neighbour 域与 struct neighbour 关联。
4.1.1 关联的目的
每个 dst_entry 对应一个 neighbour,这样在路由之后,立刻能找到对应的 neighbour,此后,数据包通过 neighbour->output 送到链路层。
以 UDP 包的发送过程为例,这个过程如下:
1
| Udp_sendmsg() ==> ip_route_output() ==> ip_route_output_slow()
|
Ip_route_output_slow() :
当查不到路由 cache 后,根据 route rule ,通过 dst_alloc() 创建一个 dst_entry 结构,这同时也是一个 rtable 结构,然后将 dst_entry 的 output 指向 ip_output()
1
| rth->u.dst.output=ip_output;
|
此后,udp_sendmsg 继续调用 ip_build_xmit() 来发包
1
| Udp_sendmsg() ==> Ip_build_xmit() ==> output_maybe_reroute ==> skb->dst->output()
|
这里的 output 就是 ip_output()
1
| ip_output ==> __ip_finish_output() ==> ip_finish_output2() ==> dst->neighbour->output()
|
因此,最终数据包是通过 neighbour->output() 往下送的。
4.1.2 关联的过程
IPv4 代码实现:ip_route_output_slow
在路由 cache 中查不到路由结果后,查找 route rule ,如果没有合适的路由规则,则失败返回。否则,通过 dst_alloc() 创建一个 dst_entry 结构,这同时也是一个 rtable 结构,此 rtable 结构被挂入 hash 表中。这时候我们已经有了下一跳的 L3地址。(也可能没有,例如绑定 interface 的情况,需要看代码是如何处理的)。
下一步,要通过arp_bind_neighbour 将 rtable 与 neighbour 进行绑定
1
| rt_intern_hash arp_bind_neighbour()
|
arp_bind_neighbour() 根据给定的下一跳 L3 地址,到 arp hash 表中找 neighbour,找到的话,dst->neighbour 就有了归宿;找不到,只好调用 neighbour_create() 创建一个新的 neighbour,这是在__neigh_lookup_errno() 中完成的
1
| arp_bind_neighbour() ==> __neigh_lookup_errno() ==> neigh_lookup() ==> neigh_create()。
|
1
2
3
4
| ip_route_output_slow()
fib_lookup()
rt_intern_hash()
arp_bind_neighbour()
|
4.2 Neighbour 的构造和设置
neigh_alloc() 用于分配 neighbour 结构
neigh_create() 进一步设置此结构,对于 ARP 来说,它调用 arp_constructor() ,在这个函数里面,对 neighbour 的 ops 域和 output 域进行设置。
Ops 域,根据底层 driver 的类型进行不同的设置,
对于没有链路层地址的,指向arp_direct_ops
对于没有链路层 cache 的,指向arp_generic_ops
对于有链路层 cache 的, 指向arp_hh_ops
对于以太网驱动程序,它的 net_device 结构在初始化的时候,已经有了默认的 hard_header 和 hard_header_cache 函数,
1
2
3
| ether_setup()
dev->hard_header = eth_header;
dev->hard_header_cache = eth_header_cache;
|
因此,默认情况下,它的 ops 指向 arp_hh_ops()
对于 output 域,关键是看 neighbour 的状态,如果是有效状态,则设置为 ops->connected_output(),这样可以加快速度,否则设置为 ops->output(),这样,需要进行 neighbor discovery 的处理。
对于 ARP 来说,无论是 output ,还是 connect_output都是指向 neigh_resolve_output()。(原因?)
neigh_resolve_output 进行 neighbor discovery 的过程。
在理解 neighbor discovery 之前,我们需要先理解 neighbour 的状态转换机制。
5. Neighbour 的状态转换
5.1 Neighbour 的状态
Neighbour 结构可以处于不同状态, 包括:
1
2
3
4
5
6
7
8
9
| #define NUD_INCOMPLETE 0x01
#define NUD_REACHABLE 0x02
#define NUD_STALE 0x04
#define NUD_DELAY 0x08
#define NUD_PROBE 0x10
#define NUD_FAILED 0x20
#define NUD_NOARP 0x40
#define NUD_PERMANENT 0x80
#define NUD_NONE 0x00
|
5.2 Neighbour 的状态转换过程
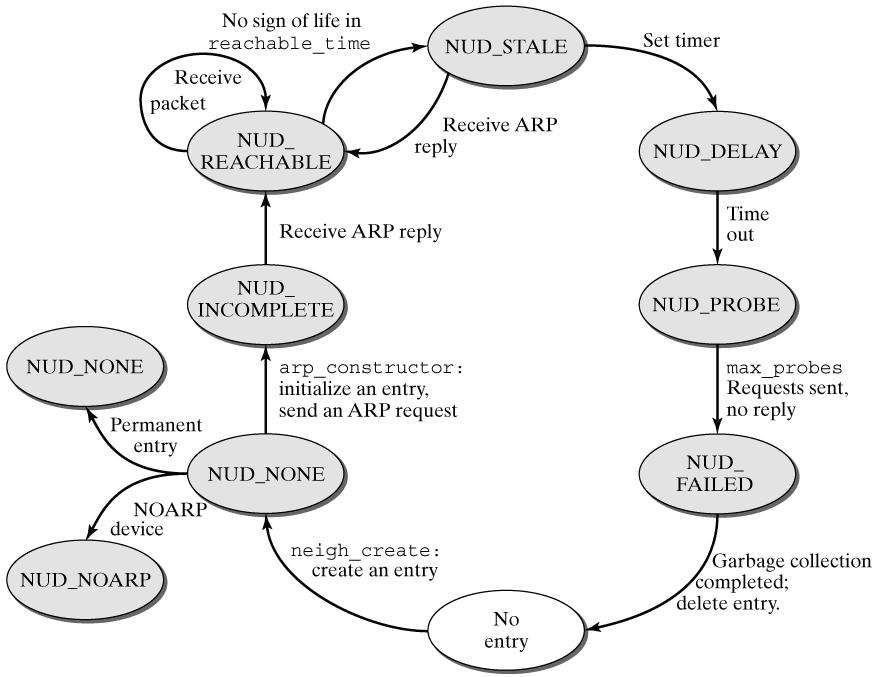
Linux 为它维护一个状态机,状态机通过 timer 以及数据包的收发来驱动。它可以描述如下:
1、 neighbour 创建后,处于 NONE 状态
2、 neigh_resolve_output() 调用neigh_event_send() 来触发状态转换;对于 NONE 状态来说,调用__neigh_event_send()。
__neigh_event_send()将 neighbour 状态设置为 INCOMPLETE,然后设置 timer,timer 的超时时间为neigh->parms->retrans_time。
然后调用neigh->ops->solicit 发送 neighbour discovery 包。对 ARP 来说就是 arp_solicit()。
对于正常收到响应包的处理,我们在 ARP 包接收部分进行分析,总之状态会转换为 REACHABLE。
如果超时未收到包,则由超时处理函数neigh_timer_handler 进行处理
3、 neigh_timer_handler() 会重传请求包,重传次数由neigh_max_probes() 计算。如果超过重传次数,则状态转为 FAILED
4、 处于 REACHABLE 状态的 neighbour,有一定的有效期(参数?),超过这个有效期后,由neigh_periodic_timer() 进行处理。
5、 第一个有效期是 reachable_time(对 ARP,这个值是 30 HZ,也就是 300ms),这个时间以后,
6、 STALE 状态的转换比较难理解。Neighbour 处于 REACHABLE 状态后,如果在一段时间内,没有收到过 reply ,那么则怀疑此 neighbor 不可达,需要将它的状态转为 STALE,但是又不立刻进行转换。(在哪些情况下进行状态转换?)
在 STABLE 状态下,再次进入__neigh_event_send的时候,则将之状态转为 DELAY,并启动定时器。(超时时间是delay_probe_time,默认为 50ms)
在 STALE 状态,并不进行 ARP 解析,数据包仍然可以直接发送出去。
7、 在 DELAY 状态,数据可以直接发送出去,但是一旦定时器超时,则转入 PROBE 状态。如果在此期间收到过 reply 包,则转为 REACHABLE。
8、 在 PROBE 状态,数据仍然可以直接发送出去。但是在此状态,开始 ARP 探测,而且仅探测一次,如果失败,则转为 FAILED;如果收到 reply 包,则转为 REACHABLE。
9、 neigh_periodic_timer 会定时把 FAILED 状态的 neighbour 清理掉
Linux 还定义了几种状态组合的变量:
1
2
3
4
5
6
7
8
9
10
11
| #define NUD_IN_TIMER (NUD_INCOMPLETE|NUD_DELAY|NUD_PROBE)
INCOMPLETE、 DELAY、PROBE 状态,有定时器在工作
#define NUD_VALID (NUD_PERMANENT|NUD_NOARP|NUD_REACHABLE|NUD_PROBE|NUD_STALE|NUD_DELAY)
以上状态,数据包都直接发送,不进行 ARP 解析过程。
当 neighbour 未处于 VALID 状态时,数据包无法发送,只能送入 neighbour-> arp_queue 中。(可以从__neigh_event_send看到相关代码)。
#define NUD_CONNECTED (NUD_PERMANENT|NUD_NOARP|NUD_REACHABLE)
|
以上状态,数据包不仅直接发送,而且可以肯定这个 neighboring 是可达的。
5.3 一个实际的 case
在笔者参与的一个嵌入式无线产品开发过程中,应用需要每隔 3s 发送一个 UDP 包出去,这个 UDP 包是单向的,也就是说只向外发送,并没有响应的包。在测试过程中发现,在每次发送 UDP 包之前,都会先有一个 ARP 查询,这种没有必要的 ARP 包不仅影响性能,也很耗电。
分析其原因,发现:
在一次成功的 ARP 解析后,neighbour 的有效期大概为 300 ms。
在第一次发送 UDP 包之前,因为 Neighbour Cache 中没有数据,所以需要发送 ARP 查询包,以获得下一跳的 MAC 地址。当收到 ARP 应答后,找到对应的 neighbour,然后将它的状态转为 STALE,然后立刻转为 DELAY,并启动 50ms 的定时器,这时候,那个导致 ARP 查询的 UDP 包可以使用 neighbour 的映射并发送出去,但是由于这个 UDP 包并不要求回应,因此50 ms 后,neighbour 的状态转为 PROBE。这样,3s 以后,下一个 UDP 包又会导致一次 ARP 查询。
解决方案:
由于此嵌入式设备的下一跳肯定是网关,因此可以先通过 ARP 查询获得网关 的 L2 地址,然后在嵌入式设备上设置一条静态 ARP 规则,这样,就再也不会有这种无实际意义的 ARP 包出现了。
6. Neighbor Discovery 的 过程
从上面的状态机可以看到,当 neighbour 处于 INCOMPLETE、PROBE 状态的时候,会发送 Neighbor Solicit 包:
例如,通过 neigh_resolve_output() 导致新创建一个 neighbour 结构后,最后会调用 neigh->ops->solicit() 来发送 NS 包,对于 ARP 来说,就是 arp_solicit():
1
| neigh_resolve_output() ==> neigh_event_send() ==> __neigh_event_send() ==> neigh->ops->solicit(neigh, skb); ==> arp_solicit()
|
arp_solicit 调用 arp_send() 构造并发送 ARP request:
对于 INCOMPLETE 状态,需要发送一个新的 ARP 请求,它的目的 MAC 地址是广播地址,这样链路上所有节点都能收到此广播包;
对于 PROBE 状态, neighbour 中已经有了对端的 MAC 地址,此时发 ARP request 的目的只是验证这个映射还是有效的,因此此时发出的 ARP 包的目的 MAC 地址可以从 neighbour 中取到,是一个单播的 ARP 包。
7. ARP 包的接收处理过程
1
| Arp_rcv() ==> arp_process()
|
如果收到的是 ARP request,且是到本机的,调用neigh_event_ns ,以创建一个新的 neighbour 结构,然后调用arp_send() 回应一个 ARP reply。
如果收到的是 ARP reply,那么调用__neigh_lookup 去查找是否有对应的 neighbour,如果没有,则丢弃此包;否则调用neigh_update() 将此 neighbour 状态更新为 REACHABLE。同时,所有在此 neighbour 上等待的数据包被发送