https://blog.csdn.net/lyg920/article/details/51658295
介绍
最初的IP协议是没有任何的安全措施的。IP数据报含有诸如源地址,目的地址,版本,长度,生存周期,承载协议,承载数据等字段。虽然其拥有“首部校验和”这样的字段来提供极其简易的完整性功能,但无力抗拒对数据的意外或者故意修改,也无法阻止信息的泄露等问题。
IPSec(Intemet Protocol Security)是由IEIF设计的一种端到端的确保IP层通信安全的机制,它不是一个单独的协议,而是一组协议。IPSec是IPv6的组成部分,也是IPv4的可选扩展协议。目前IPSec最主要的应用是构造虚拟专用网(VPN),它作为一个第三层隧道协议实现了VPN通信,可以为IP网络通信提供透明的安全服务,保证数据的完整性和机密性,有效抵御网络攻击。它所使用的加密算法和完整性验证算法从目前看来是不可能被破解的。定义IPSec协议簇的RFC如表3.5.1所示。
1
2
3
4
5
6
7
8
9
10
11
12
13
RFC  内容
2401  IPSec体系结构
2402  AH协议
2403  HMAC-MD5-96在AH和ESP中的应用
2404  HMAC-SHA-1-96在AH和ESP中的应用
2405  DES-CBC在ESP中的应用
2406  ESP协议
2407  IPSec DOI
2408  ISAKMP协议
2409  IKE协议
2410  NULL加密算法及其在IPSec中的应用
2411  IPSec文档路线图
2412  OAKLEY协议
IPSec众多的RFC通过关系图组织在一起,IPSec各组件的关系图如图3.5.1所示。
它包含了三个最重要的协议:认证头AH(Authentication Header),封装安全载荷ESP(Encapsulating Security Payload),密钥交换协议IKE(Internet Key Exchange),注意这些协议的使用均可独立于具体的加密算法:
(1)AH为IP数据包提供3种服务(统称验证):数据完整性验证,通过使用Hash函数(如MD5)产生的验证码来实现;数据完整性时加入一个共享的会话密钥来实现;防重放攻击,在AH报头中加入序列号可以防止重放攻击。
(2)ESP除了为IP数据包提供AH上述的3种服务外,还能够提供数据加密。
3.5.2 技术细节
(1)认证头(AH)
AH概述
IPSec的子协议头认证协议AH,为IP报文提供数据完整性验证和数据源身份认证,使用的是HMAC算法,HMAC算法和非常相似,一般是由Hash算法演变而来,也就是将输入报文和双方事先已经共享的对称密钥结合然后应用Hash算法。采用相同的HMAC算法并共享密钥的双方才能产生相同的验证数据。所有的IPSec必须实现两个算法:HMAC-MD5和HMAC-SHA1.
AH和ESP的最大区别有两个:一个是AH不提供加密服务,另一个是它们验证的范围不同,ESP不验证IP报头,而AH同时验证部分报头,所以需要结合使用AH和ESP才能保证IP报头的机密性和完整性。AH为IP报头提供尽可能多的验证保护,验证失败的包将被丢弃,不交给上层协议解密,这种操作模式可以减少拒绝服务攻击成功的机会。
AH头部格式
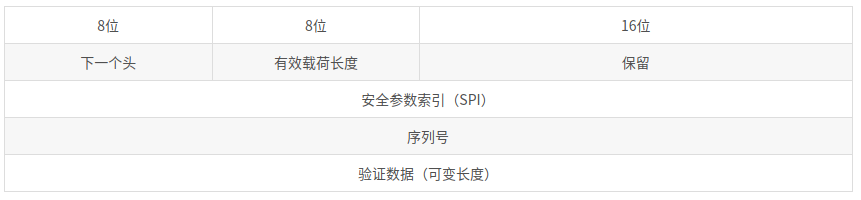
AH协议是被IP协议封装的协议之一,如果IP协议头部的“下一个头”字段是51,则IP包的载荷就是AH协议,在IP包头后面跟的就是AH协议头部。AH报文头部如图3.5.2所示。
(1)下一个头(8位):表示紧跟在AH头部后面的协议类型。在传输模式下,该字段是处于保护中的传输层协议的值,如6(TCP),17(UDP)或50(ESP)。在隧道模式下,AH保护整个IP包,该值是4,表示是IP-in-IP协议。
(2)有效载荷长度(8位):其值是以32位(4字节)为单位的整个AH数据(包括头部和变长验证数据)的长度再减2。
(3)保留(16位):准备将来对AH协议扩展时使用,目前协议规定这个字段应该被置为0。
(4)安全参数索引SPI(32位):值为[256,232 -1]。实际上它是用来标识发送方在处理IP数据包时使用了哪些安全策略,当接收方看到这个字段后就知道如何处理收到的IPsec包。
(5)序列号(32位):一个单调递增的计数器,为每个AH包赋予一个序号。当通信双方建立SA时,初始化为0。SA是单向的,每发送/接收一个包,外出/进入SA的计数器增1。该字段可用于抗重放攻击。
(6)验证数据:可变长,取决于采用何种消息验证算法。包含完整性验证码,也就是HMAC算法的结果,称为ICV,它的生成算法由SA指定。
(2)封装安全载荷(ESP)
ESP概述
ESP协议提供数据完整性验证和数据源身份认证的原理和AH一样,只是和AH比ESP的验证范围要小些。ESP协议规定了所有IPSec系统必须实现的验证算法:HMAC-MD5,HMAC-SHA1,NULL。和L2TP,GRE,AH等其他轨道技术相比,ESP具有特有的安全机制——加密,而且可以和其他隧道协议结合使用,为用户的远程通信提供更强大的安全支持。ESP加密采用的则是对称加密算法,它规定了所有IPSec系统必须实现的加密算法是DES-CBC和NULL,使用NULL是指实际上不进行加密或验证。
ESP头部格式
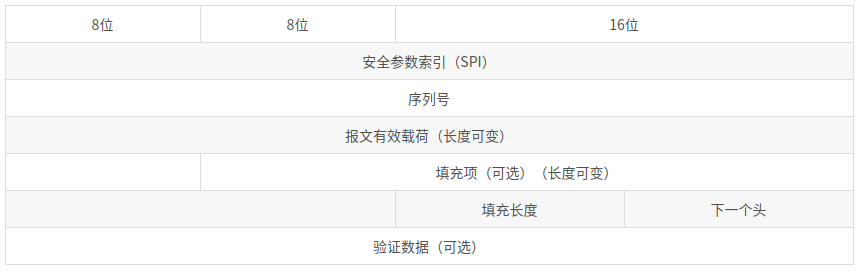
ESP协议是被IP协议封装的协议之一。如果IP协议头部的“下一个头”字段是50,IP包的载荷就是ESP协议,在IP包头后面跟的就是ESP协议头部。ESP报文头部如3.5.3所示,其中ESP头部包含SPI和序列号字段,ESP尾部包含填充项,填充长度和下一个头字段。
(1)安全参数索引SPI(32位):值为[256,232 -1]。
(2)序列号(32位):一个单调递增的计数器,为每个AH包赋予一个序号。当通信双方建立SA时,初始化为0。SA是单向的,每发送/接收一个包,外出/进入SA的计数器增1。该字段可用于抗重放攻击。
(3)报文有效载荷:是变长的字段,如果SA采用加密,该部分是加密后的密文;如果没有加密,该部分就是明文。
(4)填充项:是可选的字段,为了对齐待加密数据而根据需要将其填充到4字节边界。
(5)填充长度:以字节为单位指示填充项长度,范围为[0,255]。保证加密数据的长度适应分组加密算法的长度,也可以用以掩饰载荷的真实长度对抗流量分析。
(6)下一个头:表示紧跟在ESP头部后面的协议,其中值为6表示后面封装的是TCP。
(7)验证数据:是变长字段,只有选择了验证服务时才需要有该字段。
很多情况下,AH的功能已经能满足安全的需要,ESP由于需要使用高强度的加密算法,需要消耗更多的计算机运算资源,使用上受到一定限制。
在IPSec协议簇中使用两种不同功能的协议使得IPSec具有对网络安全细粒度的功能选则,便于用户依据自己的安全需要对网络进行灵活配置。
(3)IPSec的两种模式
a. 传输模式
传输模式(Transport Mode)是IPSec的默认模式,又称端到端(End-to-End)模式,它适用于两台主机之间进行IPSec通信。
传输模式下只对IP负载进行保护,可能是TCP/UDP/ICMP协议,也可能是AH/ESP协议。传输模式只为上层协议提供安全保护,在此种模式下,参与通信的双方主机都必须安装IPSec协议,而且它不能隐藏主机的IP地址。启用IPSec传输模式后,IPSec会在传输层包的前面增加AH/ESP头部或同时增加两种头部,构成一个AH/ESP数据包,然后添加IP头部组成IP包。在接收方,首先处理的是IP,然后再做IPSec处理,最后再将载荷数据交给上层协议。
传输模式的数据包结构
b. 隧道模式
隧道模式(Tunnel Mode)使用在两台网关之间,站点到站点(Site-to-Site)的通信。参与通信的两个网关实际是为了两个以其为边界的网络中的计算机提供安全通信的服务。
隧道模式为整个IP包提供保护,为IP协议本身而不只是上层协议提供安全保护。通常情况下只要使用IPSec的双方有一方是安全网关,就必须使用隧道模式,隧道模式的一个优点是可以隐藏内部主机和服务器的IP地址。大部分VPN都使用隧道模式,因为它不仅对整个原始报文加密,还对通信的源地址和目的地址进行部分和全部加密,只需要在安全网关,而不需要在内部主机上安装VPN软件,期间所有加密和
解密以及协商操作均由前者负责完成。
启用IPSec隧道模式后,IPSec将原始IP看作一个整体作为要保护的内容,前面加上AH/ESP头部,再加上新IP头部组成新IP包。隧道模式的数据包有两个IP头,内部头由路由器背后的主机创建,是通信终点;外部头由提供IPSec的设备(如路由器)创建,是IPSec的终点。事实上,IPSec的传输模式和隧道模式分别类似于其他隧道协议(如L2TP)的自愿隧道和强制隧道,即一个是由用户实施,另一个由网络设备实施。
1
外部IP头 IPSec头 内部IP头 IP载荷
隧道模式下,隧道中的数据包结构
(4)身份验证与AH
AH通过对报文应用一个使用密钥的单向散列函数来创建一个散列或消息摘要来进行身份验证。散列与文本合在一起传输。接收方对接收到的报文运用同样的单向散列函数并将结果与发送方提供的消息摘要的值比较,从而检测报文在传输过程中是否有部分发生变化。由于单向散列也包含两个系统之间的一个共享密钥,因此能确保真实性。
AH作用于整个报文,但任意会在传输中改变的IP头字段除外。例如,由沿传输路径的路由器修改的生存时间(Time to Live, TTL)字段是可变字段。
AH的处理过程顺序如下。
步骤1 使用共享密钥对IP头和数据载荷进行散列。
步骤2 散列构建一个新的AH头,插入到原始报文中。
步骤3 新报文路由器使用共享密钥对IP头和数据载荷进行散列,从AH头中取出传输的散列,再比较两个散列。
散列值必须精确匹配。如果报文传输中有一个比特位发生了变化,则接收到的报文的散列输出将改变,AH头将不能匹配。
AH支持HMAC-MD5和HMAC-SHA-1算法。在使用NAT的环境中,AH可能会遇到问题。
(5)使用ESP进行身份验证与加密
ESP通过加密载荷实现机密性,它支持多种对称加密算法。如果选择了ESP作为IPSec协议,也必须选择一种加密算法。IPSec的默认算法是56位DES。
ESP也能提供完整性和认证。首先对载荷加密,然后对加密过的载荷使用一种散列算法(HMAC-MD5或HMAC-SHA-1)。散列为数据载荷提供认证和数据完整性。
作为可选功能,ESP还能进行防重放保护。防重放保护验证每个报文是唯一的且没有被复制,这种保护确保黑客不能拦截报文和在数据流中插入改变后的报文。防重放的工作原理是跟踪报文顺序号并在目的端使用一个滑动窗口。当在源和目的间建立了一条连接时,两端的计数器被初始化为0。每次有报文发送时,源给报文追加一个顺序号,目的端使用滑动窗口确定预期的顺序号。目的端验证的报文的顺序号不是复制的,并且以正确的顺序被接收。例如,如果目的端的滑动窗口设为1,目的端期望接收到顺序号为1的报文。收到这样的报文后,滑动窗口进入到2.如果检测到重放的报文,重放报文将被丢弃,对此事件记录日志。
原始数据通过ESP得到良好保护,因为完整的原始IP数据报和ESP附加尾部都被加密。使用ESP认证,加密的IP数据报和附加尾部以及ESP头都得到散列进程处理。最后,一个新的IP头被附加到经过认证的载荷,使用新的IP地址在Internet中路由报文。
如果同时选择了认证和加密,先执行加密。这种处理顺序的一个原因是它有助于接收设备快速检测和丢弃重放的或伪造的报文。在解密报文之前,接收方可以认证进入的报文。这样可以快速检测到问题,并间接的降低了DoS攻击的影响。
(6)IPSec工作流程
(7)IPSec的好处
a.节约成本和方便网络管理
b.IPSec隧道可以用来创建安全的网络
c.IPSec隧道可以用来安全的远程管理
d.确保安全通信的认证和机密性
e.数据包认证提高了地址伪装与地址欺骗攻击的难度
f.通过non-end-to-end服务,IPSec可以确保一对或一组站点之间的消息都是加密的